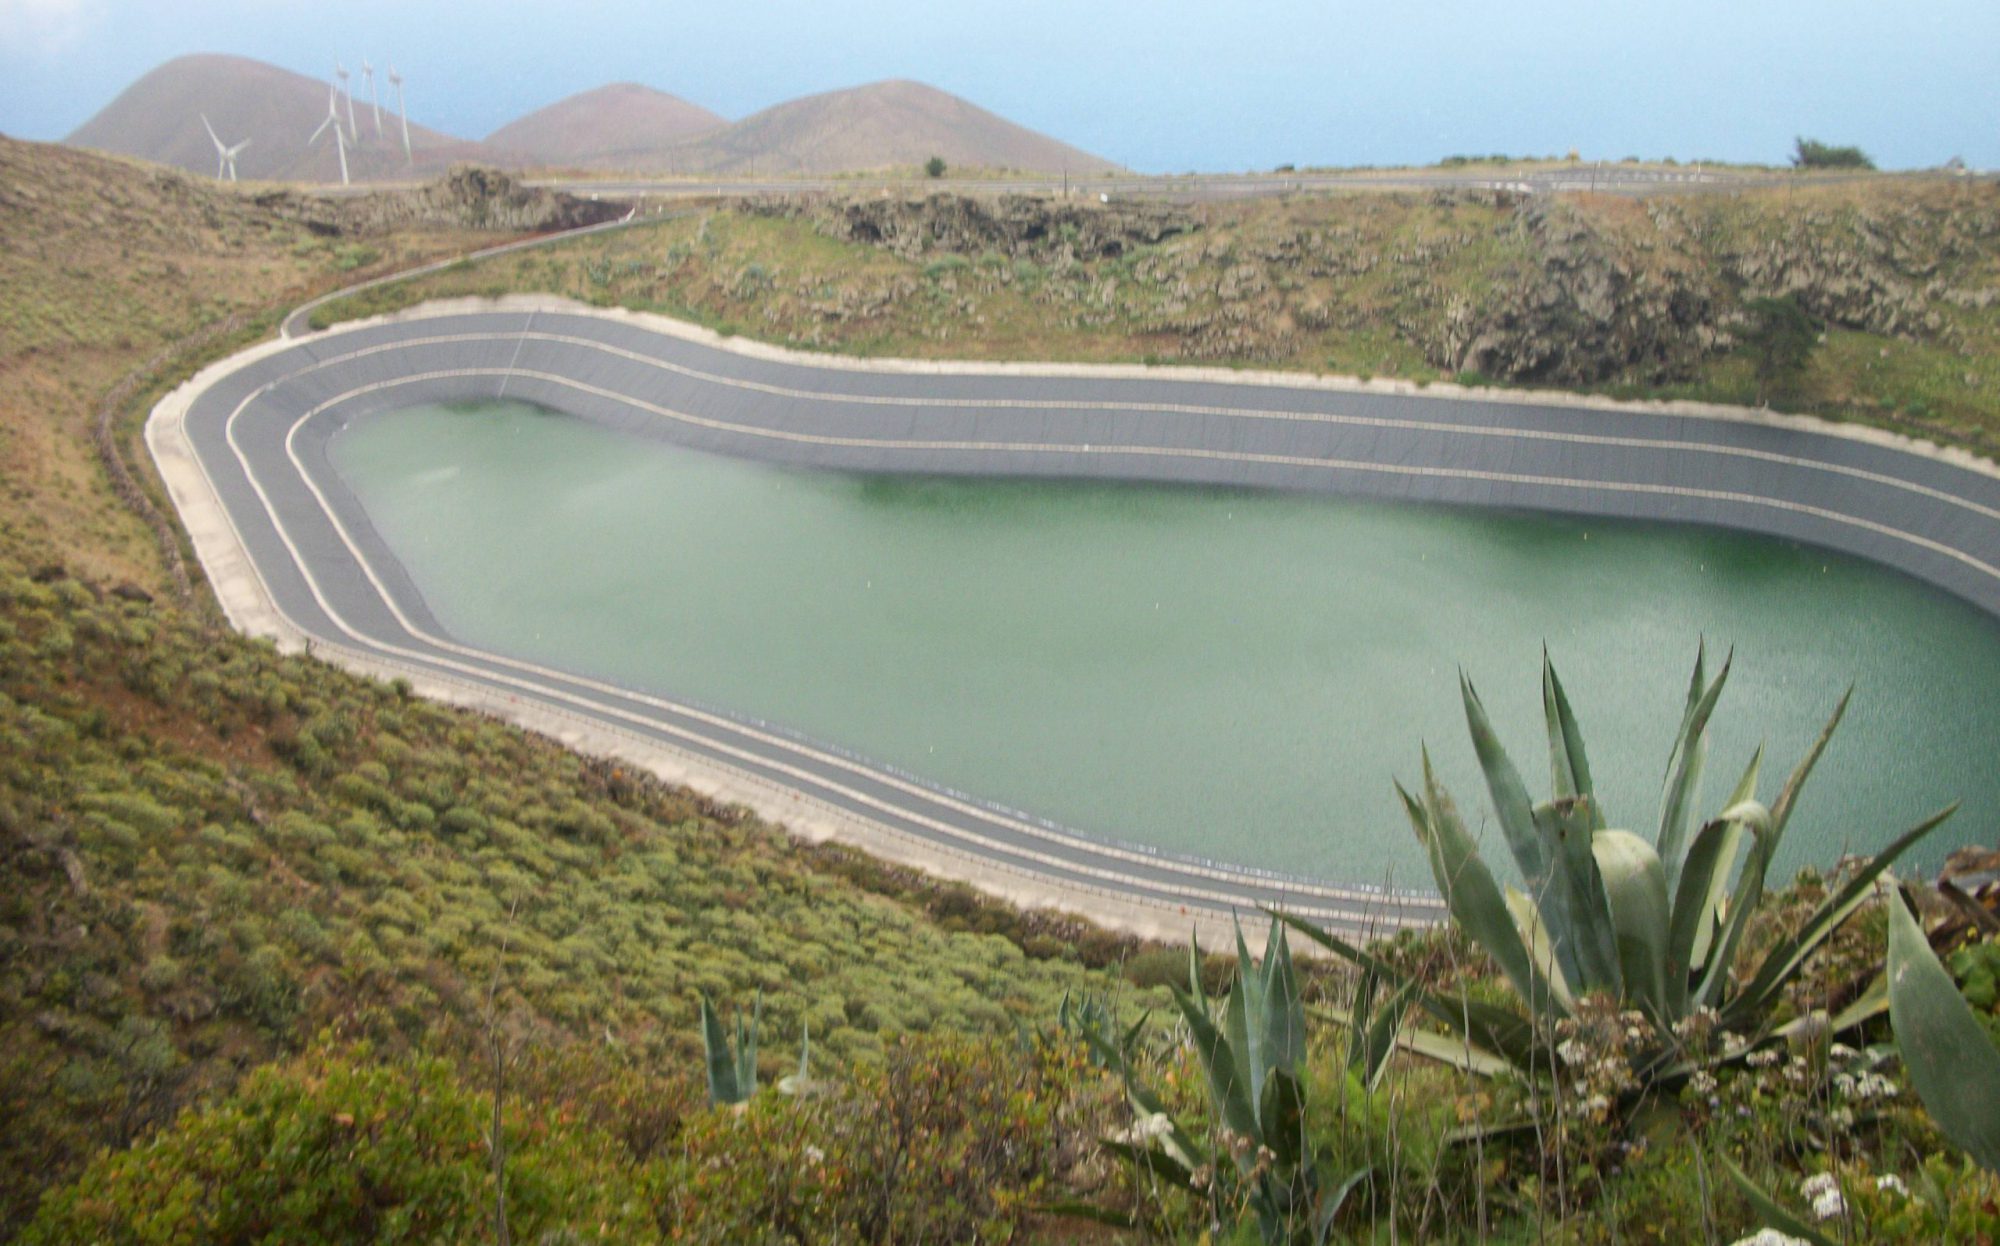
This data collection was created for the following reason.
“Gorona del Viento” had not published any traceable data about the combined wind and hydropower plant on El Hierro until early 2019.
Unfortunately unrealistic information was disseminated by “Cabildo de Hierro”, the island Government and owner of Gorona del Viento.
Then i stumbled over the -> Blog of Roger Andrews where i could find some base data.
I myself was often on the island, so i started to collect frequency data on site and published it.
For this I used a non-calibrated frequency measuring device called “Mutatio” thanks to Damian Schneider in our house on El Hierro.
Also i collected data as far as possible on site.
These are documented in the Cloud “GDV/Field-studies-JJJJ-MM-DD”.
Since 2019 -> “Gorona del Viento” publish data here:
Spanish -> INFORMACIÓN ESTADÍSTICA Y DATOS.
2018-2023
English -> STATISTICAL INFORMATION AND DATA.
only 2018-2020 shown, 2021+2022+2023 > IT-Nirvana??
*********************************************
My personal knowledge after watching Gorona del Viento data since 2015:
Data extracted from -> Red Eléctrica de España:
| diesel off or 100% RE | |||||
| Year | h total | h 100% RE | % | ||
| sum from: to last date | 2015-07-27 | 78888 | 10492:25:00,00 | 12,65 | |
| 2015 | 8760 | 02:00:00 | 0,02 | ||
| 2016 | 8784 | 546:00:00,00 | 6,22 | ||
| 2017 | 8760 | 923:00:00,00 | 10,54 | ||
| 2018 | 8760 | 2627:40:00,00 | 29,99 | ||
| 2019 | 8760 | 1939:10:00,00 | 22,13 | ||
| 2020 | 8784 | 1291:00:00,00 | 14,70 | ||
| 2021 | 8760 | 1277:10:00,00 | 14,58 | ||
| 2022 | 8760 | 926:25:00,00 | 10,57 | ||
| 2023 | 8760 | 413:35:00,00 | 4,71 | ||
| last date | 2024-07-23 | 2024 | 4944 | 546:25:00,00 | 11,04 |
The side
https://app.electricitymaps.com/mapshows that CO2 per kwh is more en El Hierro than in Spanish Mainland or Germany since 2019 till now.
Everybody can make his own mind up with that information……
https://app.electricitymaps.com/map

The side
https://app.electricitymaps.com/map shows that Renewable in % is more or same in Germany than in El Hierro since January 2023.
Everybody can make his own mind up with that information……
*********************************************
monthly data in spanish edition only
look there for “Informes mensuales”
-> Información estadística y datos
Live Data El Hierro:
-> Red Eléctrica de España
-> Wind Aeropuerto
-> electricity mix live on world map
